By Jason Spitkoski (updated Sept 12, 2025)
The neighbourhood is lucky to have engaged and committed citizens who are seeking to improve our overall environment. One example of such dedication is a project that was kicked of last year and is updated below. Can you help?
Digital Waters is a Toronto-based non-profit developing affordable, made-in-Canada water monitoring technology to better understand and protect our local waterways.
We were inspired by Toronto’s ravines. They are amazing veins of nature that stretch across town, always lush and green in the summers and the perfect way to take a break from life. But nothing lives in the waters that carve out Toronto’s ravines.
Yellow Creek has a few drainage pipes and storm outputs in the three kilometres of its shoreline between Mount Pleasant Cemetery and the Don River. Oftentimes, there is discoloration in the water. Sometimes the whole creek suds up, like someone dumped a barrel of foam. The creek had different smells that accompanied the different water colour. Sometimes the water was green, sometimes a dark grey, sometimes a creamy white, sometimes a more sinister dark red. Regardless of the colour though, nothing lives in the water.
But sending a photo of the water to a city worker and expecting anything to be done isn’t realistic. Especially if the contamination happens intermittently. What’s more, municipalities and governments around the world don’t have a budget to combat water pollution in a significant way.
Coming up with a log of specific location, time of day, water colour/temperature/other details, weather conditions, are what are needed to really build a compelling case. Having year-round water quality data allows us to compare the same waterway year over year.
Imagine how powerful that information would be in trying to pinpoint where and when pollution is entering our water. I thought about how people could organize to put low-cost water monitoring devices in our waterways to find exactly where bad water is entering our water.
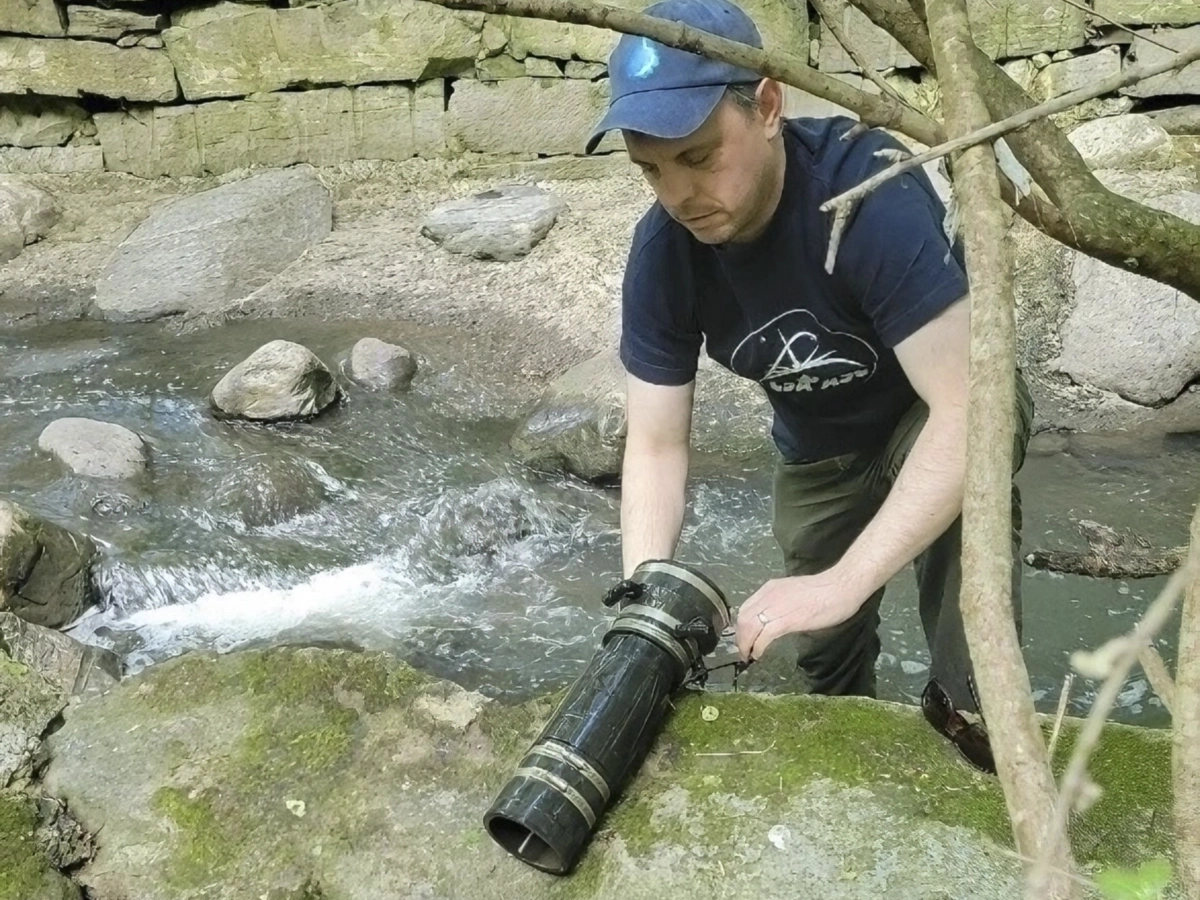
Since early fall of 2024, we’ve been monitoring Yellow Creek using a series of three devices spaced roughly 500 meters apart along the creek, beginning just south of Mount Pleasant Cemetery.
Each device captures high-frequency data, photographs and temperature readings are taken every few minutes and published in near real-time on our website. Our goal is to provide continuous, publicly accessible insight into the conditions of urban waterways across the GTA.
In Yellow Creek, we’ve observed notable differences in water quality over short distances. At the northernmost monitoring point, where the creek first emerges from Toronto’s stormwater infrastructure, the water is consistently murky, often carrying sediment and a greyish tone even on clear days. Yet just 500 meters downstream, the water appears significantly clearer.
This natural self-filtering process is striking. However, clearer water is not always cleaner water. Yellow Creek receives runoff from several stormwater outlets, and because much of the creek flows through buried infrastructure, it is exposed to road residue, construction discharge, and occasionally sewage overflow. Especially after heavy rain.
Some of the patterns we’ve recorded, including persistent cloudiness upstream and abrupt changes in water chemistry, suggest that poor water quality in Yellow Creek may not be limited to storm events but may also reflect ongoing, systemic issues.

These findings are not definitive, but they raise important questions. What is the source of these consistent pollutants? How resilient is this urban creek system over time? What does “normal” even mean for a waterway surrounded by dense infrastructure?
Digital Waters is currently expanding its monitoring network and seeking local collaborators, both individuals and organizations, who are interested in data-driven approaches to watershed stewardship. If you’re curious to explore our findings, contribute time or expertise, or support the work we’re doing, we’d love to hear from you.
Visit our dashboard to view the data, or reach out to us directly via email.